A value stream is a “Lean Manufacturing” tool.

It is a way to identify where customers experience value and where we consume value to provide our product or service.
The approach is quite simple.
Problem
Begin with a problem statement (here are some templates).
In this example I will begin with the problem that we get a lot of packages in our company but the couriers are often late and we think it would be cool to use drones.
Here is our problem:
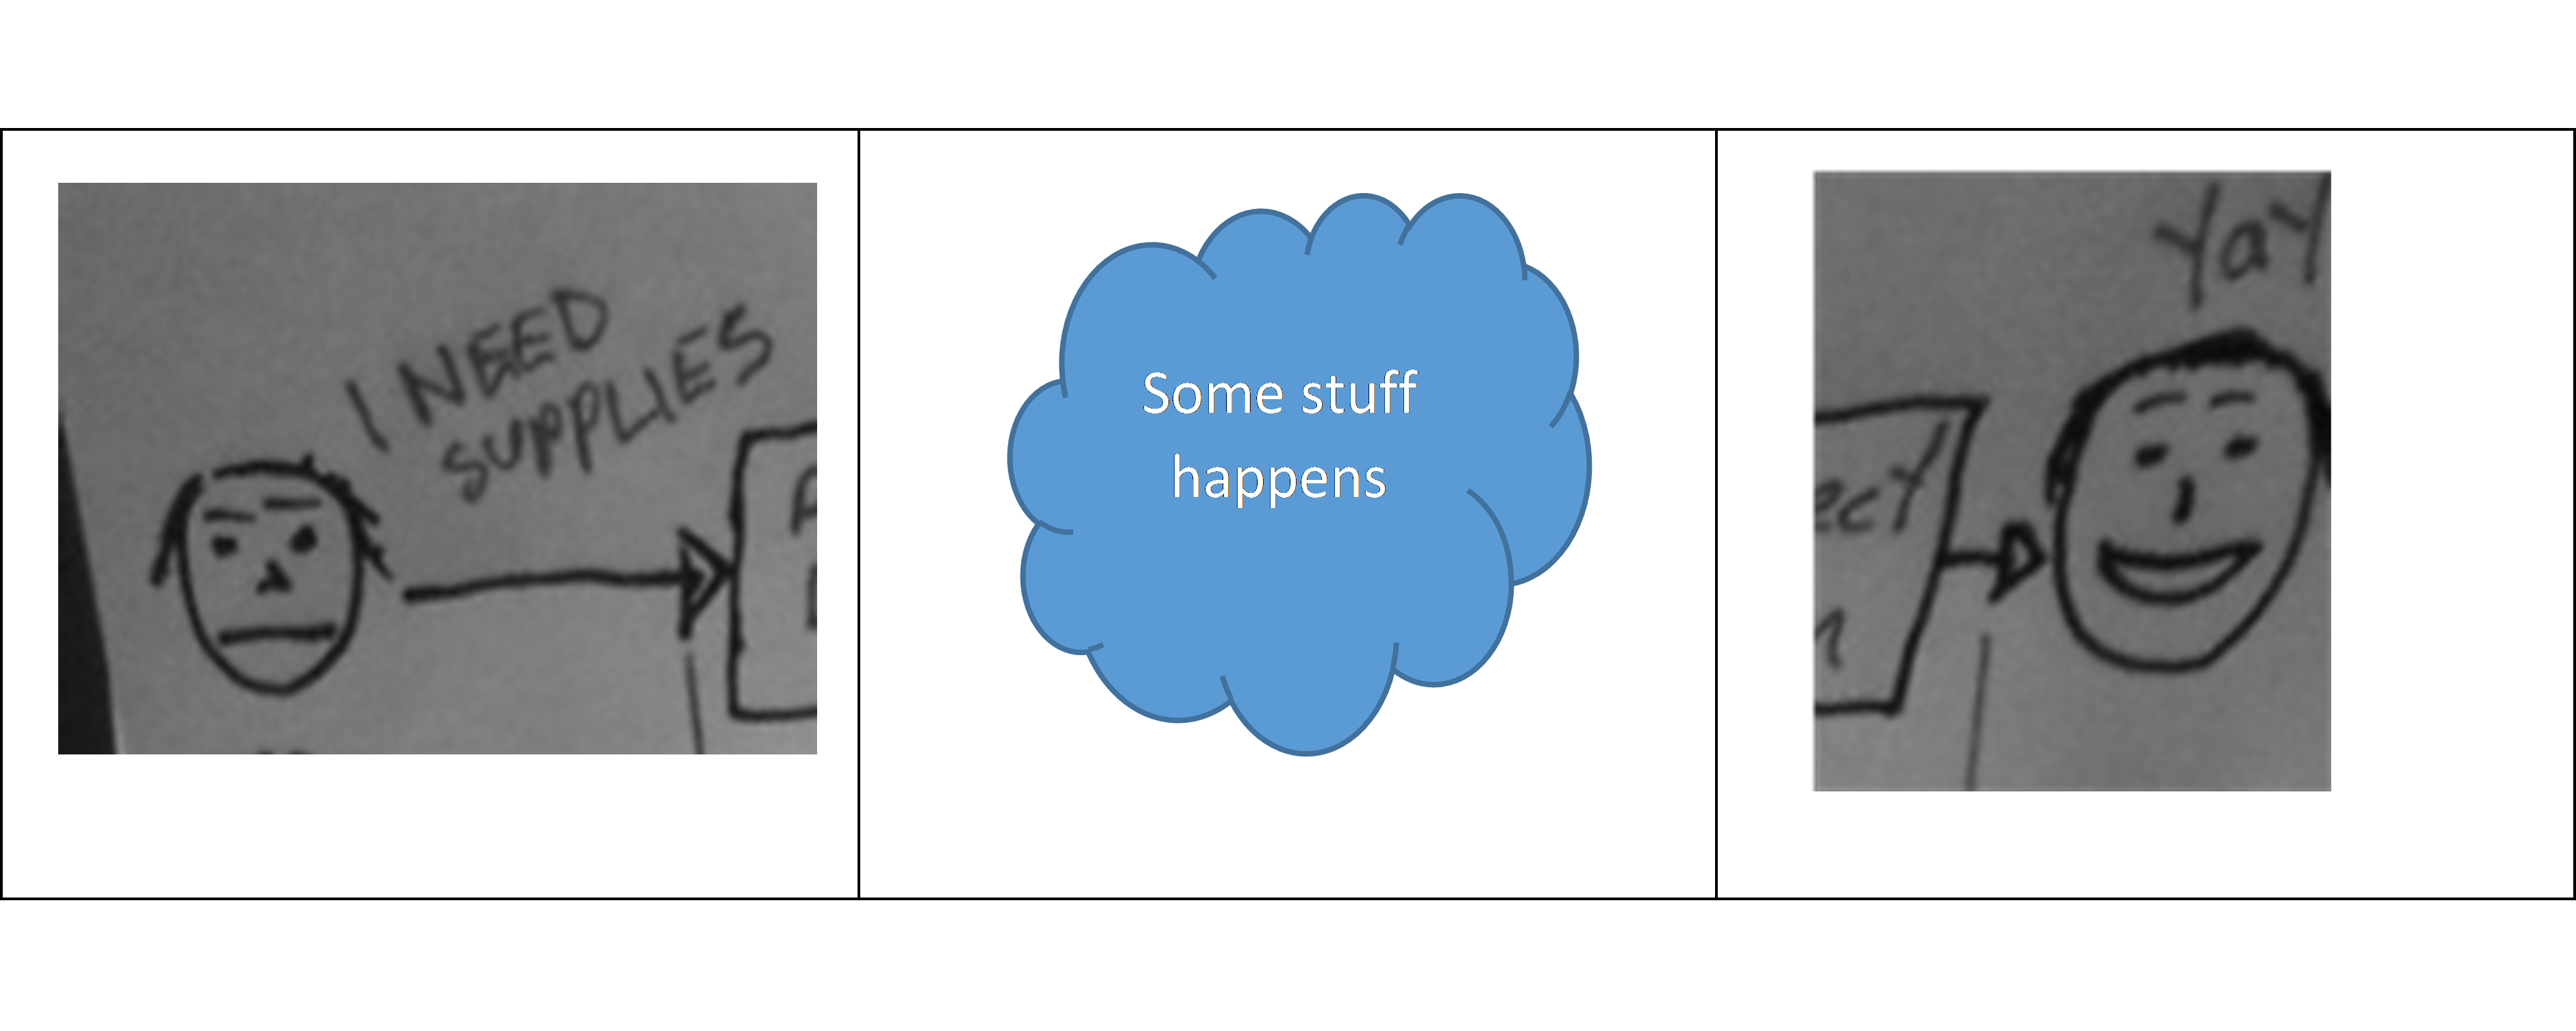
Our consultants need a better way to obtain important stationery, snacks and coffees because we are missing client deadlines while scrounging for supplies.
Map the value created
I always think of a value stream map as a process model (apparently that is philosophically misguided … but that is how I think of it).
However it is not a model of PART of a process. The reason it is called a value stream map is that it maps the creation of value. This concept matters because a value stream map is designed to make us focus on the whole process of adding value to the customer, rather than just the process of building potential value.
Therefore we have to start with a customer problem, even if the customer is an internal one. Then we have to end with that customer having received value (they can now use the product, their issue is solved, they can do something they could not do before).
So the first step is to draw a customer who is unhappy. Then add a cloud and draw a customer who is happy.
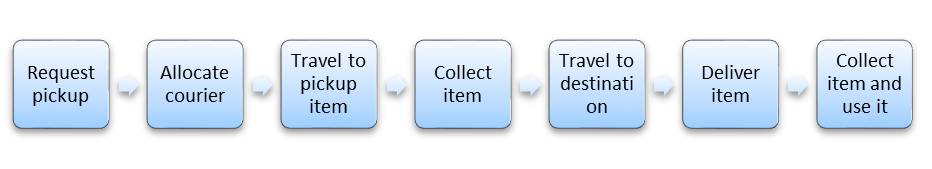
Add some squares – these are the steps taken on the journey to adding value
Just like in a normal process model, add the steps taken to go from sad customer to happy customer.
In this case I am mapping our current state (“As-is”) process for supplying things to our crew member:
Add some triangles
In a typical business process model, you would add some swimming lanes and then specify who does each step.
But that’s a bit boring. Value stream maps are much cooler because we add triangles between each of the steps, rather than worrying about who does things or how things work in detail.
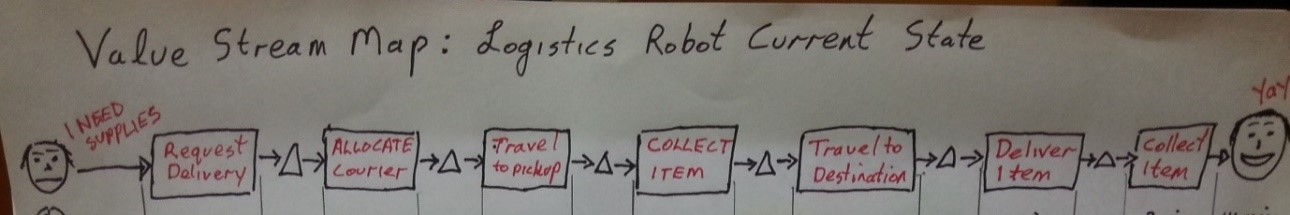
So remember – triangles cool; swimming lanes old school.
There is no robot here doing things – we are using a traditional courier because this is our current state.
Now map the consumption of value – starting with time
This is why we added the triangles – because time is passing whether we are actively doing something AND while we are waiting for someone to do something.
So now we look at the time taken doing something (each square) and the time spent waiting (each triangle).

Without the triangles we might harder in each step, or we might automate each step, but then we might still end up waiting for someone to do the next step. There is no value in half doing a job, so we want to improve both the time taken to do something and the time we spend waiting.
But wait – there is more.
Our customer’s time is important so we are consuming customer happiness while they wait for the solution. The ultimate solution would be instant.
Of course our delivery will never be instant, but asking why it can’t be instant will always result in the answer “because of constraint X”. This is the maximum point of leverage where any improvement we make will have real value.
Why can’t the consultant get their coffee and stationery instantly? Well they might be able to if:
- They had a coffee machine and a 3-D printer; or
- We could anticipate their need before it arose;
So we now have more options than just using a drone for delivery.
We can also now look at whether the drone will speed things up.
- Some things will be faster (flying drones are faster than couriers on bikes or consultants walking to a coffee shop).
- Some things take a long time because they have nothing to do with travel time. So the drone won’t help here at all.
Map errors where they occur and where they are noticed
Nothing sucks more than waiting a long time for a coffee and then finding they gave you stupid frapio-dodgy- chino with sugar … or you wanted a white board marker and you waited all day for a flip chart marker.
Errors suck away happiness and cost a lot of money (and time).
Stop there or flavour to taste (or Flavor to taste if not Australian)
You might go back to doing “a swim lane” or other cool model now you have the high level view of where you are creating value and how value is consumed or destroyed along the way
Or you could add more rows to your value stream map, for example:
- Cost of processing
- Skills needed
- People involved
- Tools/IT systems used
- Etc
You could also stop to validate, challenge and assess your information now – maybe using these cool acronyms.
Of course the odds are that you don’t need to do more analysis. You have done sufficient analysis to prove that you really do need flying drones after all. But at least now you can compare the cost (and risk) of having them with the cost and risk (and time and errors) involved with not having them.

Leave a comment