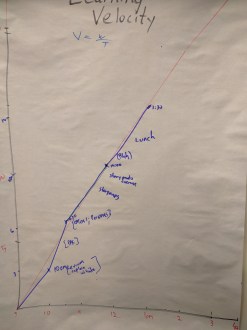
Velocity is possibly the most used, most loved and most misunderstood measure in agile projects. You will often see a rough chart like this one near your local agilistas … or you might find that they have a beautiful electronic version.
But what is velocity and how do people use it?
This is the first of three articles
In this article, I will introduce velocity and then apply it to the topics I presented in a training course. I hope this will show you how it works.
In the second article, I will show you some different velocity graphs so you can see what they might look like in a real team. Once you have read that, you should be able to make sense of a velocity chart when you see one. This will cover “burn down and burn up.”
In the final article, I argue that “velocity” is not a stand alone measure. For it to be useful, you need to be able assess if you are moving in the right direction and building things the right way.
The basic idea of velocity
Lets start with the basics.
In physics, velocity is distance over time and if you are building a rocket you might want it to have a high velocity so you can get to Mars in days instead of years. But the goal is to get to Mars, not to just go really fast.
A lot of people in agile teams think that velocity is a goal for them to achieve (punching out lot’s of work) but in fact velocity is a measure that is meant to help discussions about both planning and dealing with constraints.
Like velocity in physics, the agile measure of “velocity” also measures activity or progress over time. But instead of measuring the speed of a team through space, we measure the amount of work the team get through in a given period of time.
This could be measured as “Use Cases completed per week”, “databases deployed per day” or many other things. Usually though it is measured as “story points completed per sprint” or “backlog items completed in a sprint”. In other words we could use a formula like this:
V (velocity) = W (work completed) / T (Time period).
Planned Velocity is therefore the work we hope to complete per unit of time (say a sprint).
Actual velocity is the work we actually completed in a unit of time (a Sprint).
Why measure speed?
If we can measure what we are getting done per sprint and we know how much work is left to be done, then in theory we can predict how long it will take to finish our work.
But also, if we can measure the capacity of a team in the next sprint (their velocity) then we can use this measure to plan how much work to commit to in the next sprint.
Finally, velocity is a good measure of health. A team that is speeding up is (hopefully) getting better and better at their work. Similarly a team that is slowing down (sadly) is hitting new constraints or burning out or finding it harder to get their work done.
But this is the big misunderstanding – a team that is going faster could also be skipping testing or not taking time to understand user needs and build good foundations in their system. A team that is slowing down might be running experiments, fixing problems or taking a long time to really identify user needs.
Thus – velocity is not a goal. Rather it is a measure we use as a tool to assist planning and our discussion of issues, constraints etc.
Did agile people steal the idea of velocity from Lean?
The Velocity measure in agile is really just a version of “Throughput” in lean.
But usually when agile people talk about doing “lean agile stuff” they measure “cycle time” rather than throughput (Velocity).
The difference is that “cycle time” measures “time over work,” or the amount of time (on average) it takes to complete a piece of work, rather than how much work can be done in a sprint.
C (cycle time for one item) = T (Time period) / W (Work completed).
For example, if I can get create 20 blobs in 10 days, my velocity per sprint (10 days work) is 20. But I could also say:
- Cycle time = days needed to create one blob = 10/20 = 0.5 days per blob.
- Daily velocity = blobs created per day = 20/10 = 2 blobs per day.
So you could say it is just a different measure of the same thing. Both allow us to predict how fast we can get through work … and both are actually meant to help us identify and manage our constraints.
But is velocity really the same as speed?
In physics, velocity is the amount of distance you cover in a unit of time (eg metres per second or kilometers per hour). Speed is the same thing.
But in physics, velocity also includes “vector” or direction and if we don’t measure direction then we are really measuring speed of getting through things, rather than “velocity”.
So our velocity charts are not measuring whether the team’s work is creating value or even if the work is completed. We could be building things, deleting them, rebuilding them, deleting them and rebuilding them … and we would get really fast at building them.
We could be going really fast in the wrong direction … of changing directions and going really fast but keep coming back to the same place. So measuring speed without direction is the same as measuring activity rather than progress.
This is something we should look into in more detail. But let’s not do it just yet.
Looking for an example
Rather than going into lots of theory, let’s look at an example of a team using velocity as a measure.
I tried using velocity in a training course I ran – appropriately it was the Agile Fundamentals course I run through SoftEd.
You can come to it in places like Australia, or you can even talk to SoftEd about running it under licence.
The first day of the course went well but we frequently got distracted, discussing topics that were only vaguely related to the concepts we were meant to be covering.
We discussed Ux, Ancient Egypt and the approach a team would take to build an obelisk, business analysts (and whether you need them) and even some guy called Luke who had a light saber.
So on day 2 I wanted to be more focused.
I was worried that we would get off message and not get through the material I needed to cover. But at the same time, many of the discussions on day one had been very useful even if they were not part of the formal course.
So I decided to list (and share) the topics we would cover for the day. That way I could ask people to prioritise and check in as we went. But without knowing how long each topic was likely to take (or even what it really was) it would be hard for them to do know how they were going.
What did I need to cover?
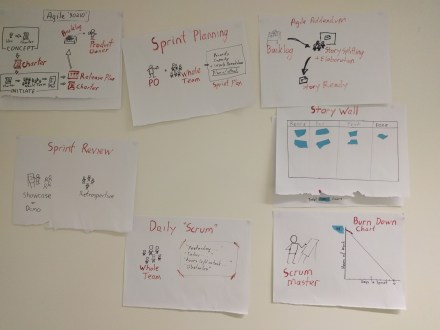
On day one we created a new standard for a team – “Agile 90201.” This helped us discuss the concepts of agile and also do a case study using our new approach, rather than using another standard approach like Safe, Scrum, Velocioraptagile or other approaches.
Note that Agile 90201 is not a real thing, we just made it up for the purpose of our learning.
In agile 90201, before the team starts sprinting anywhere, we define the problem the team are tackling. In agile 90210 we call this a “concept bit” and it produces a project charter (or an explanation of the problem). We had covered this on day one.
On day 2 we needed to master “how the agile team plans its work collaboratively before they get too far into the project”. We call this the “initiate bit” in agile 90210 and it is where the team collaboratively come up with an understanding of needs, an initial design and a plan for how to use all this to evolve the solution for the rest of the project. We also wanted to cover how people plan and understand needs throughout the project. Quite a lot to cover … getting behind would be a big problem (and easy to do) but not covering these things properly would leave a huge whole in our team’s understanding of agile.
Setting a velocity for the class
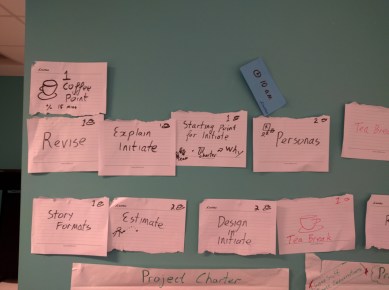
I figured if I knew the topics to cover and I created individual cards with each topic on, then we would understand our agenda (backlog) for the day.
I put these up on the wall so I could tell the class what I thought we would be covering.
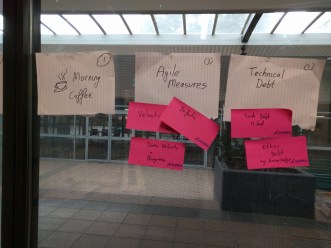
Predictably, the group added some things that they thought we should do. I added these to the end and said if we had time we should cover them.
People wanted to talk about applying agile to a BA team who sometimes worked outside agile and they wanted to talk about how to apply agile planning to an ongoing production support and enhancement team. I also wanted to have time for revision, retrospectives, lunch and other important things.
But now I wanted a measure of progress so we could check in and see whether we were ahead or behind schedule. I can use a story wall with all the topics on … but some are much much bigger than others.
Distance (or work) but as yet no “speed” of travel
Now I had our work to cover for the day, but not a measure of how we were progressing.
I could measure this in slides per hour
I have a hefty set of powerpoint slides that i can inflict on the class. I could then see how many slides we have to get through in the day (300) and thus how many we need to cover each hour (say 50). But some topics have a lot of silly slides that I skim over while others have one slide with a huge exercise for the class to do. So I didn’t think “slides covered per hour” was a good measure of our progress.
How much can you cover over a cup of coffee?
So instead I invented a new measure – coffee points. One coffee point (1cp) is equal to the amount of material you could cover over one coffee (say 15-20 minutes). Thus some topics are easy – I could explain the definition of “Initiate” over a single coffee.
But other topics are more complicated.
To explain “Story Maps” quickly is possible, but I had a big exercise for the group to do which would take a lot of time out of the day. I guess I could allocate 3 CPs (coffee points) to this. Thus I could probably explain initiate about three times to people in about the same time it takes our class to cover Story maps.
Unlike “story points” I have equated CPs to rough blocks of time. One CP is about 15 minutes so I should be able to teach the class at a rate of 4 CP’s per hour. This is planned learning velocity.
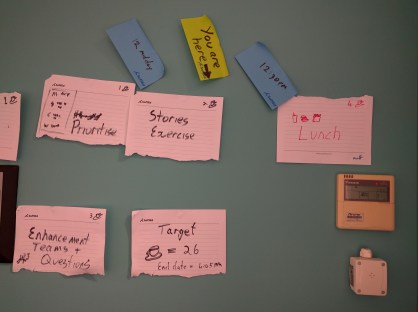
Looking at the topics we wanted to include and included valuable learning exercises of tea breaks and lunch (hmmm…) we have a total of 23 CPs to cover before 5pm. This is quite achievable. But now I have scope creep (new topics) so I compare them to my other topics and decide I have about another 4 points of things we will probably cover and a few more points of things we probably won’t.
We then cut back and decided to aim to cover 26 points before 4:45pm. We agreed we could add more content but we need to either speed up some of the other topics or drop something until the next day because we did not want to stay after 5pm. We also agreed that if we were making good time then we could reassess our goals after lunch.
This is great because we can prioritise our work and then plan out the day. I drive this quick session as I already have a plan but we make a couple of changes based on people’s views. Now if we add more topics or fall behind, we can see the impact on the things we are going to drop.
We agreed our plan and started work for the day. I guess this is the same idea as the agile 90210 stopping to do an “initiate bit.”
This took some time to do but did help with the introduction of the day and was related to some topics I would be teaching so the impact was not too bad. In the same way our agile 90210 team want to spend a few days planning their project but not a few weeks. Otherwise they are eating into their ability to both deliver value and learn what is really needed.
Here is our starting point for the day:
We checked in at 10am to see if we were tracking OK and strangely we were. We has started on the topic of “personas” but could not count these points so we were 3 points in after the first hour (our planned velocity was 4 points). If we continue at that rate we will not complete 25% of our work … but given it is just the start of the day and included unplanned time to (ironically) plan the day, we were not too worried.
We checked in during the day to see if we were on time and to see if we wanted to add anything, speed through some less important topics or make other changes.
But rather than just put a post-it note on the wall to show where we were at I also created a “learning velocity chart”. This is the velocity chart you see at the beginning of this article.
That way I can project our current speed in CPs per hour and compare that to Total CP’s for the day. We checked in every hour and for the most part we were on schedule. Some things went quicker than planned and other things went slower.
At lunch time we were confident that we were more or less OK to include everything but after 3 pm we suffered from a loss of momentum and found ourselves slowing down. We had a retrospective, a tea break and then recommitted to applying ourselves.
At the end of the day we finished exactly on time … but of course we had fixed finish time so this was no surprise. We also covered roughly the scope we wanted and everyone felt they learned a lot.
On day three though we had an interesting discussion. We used our velocity chart to do a retrospective and reflected on day 2.
We agreed we could have substantially increased our learning velocity if we had skipped all the interaction, discussion and questions. We would have gone through the material at least twice as fast.
But then some people commented that there was more learning when people interacted than when they listened to me blasting out my views while punching through the slides. So maybe increasing our CP per hour score would not actually equate to learning faster.
Then someone commented that it was a bit slack to include tea breaks and lunch as learning. I replied that they were the bits where we had our best estimates – we estimated that lunch would be exactly one hour and it was.
But then people complained that lunch was not part of our learning. I said that we should have been learning over lunch by talking about the material, but one participant revealed that he was not learning over lunch. He was actually answering emails and doing things that did not contribute to our course goals.
He claimed that in fact our velocity measure was not at all a good measure of what he had learned. He claimed that in fact the retrospectives, presentations and discussions were probably a better measure of learning than “coffee points per hour”.
This is something true of all teams I guess. When we have Chinese new year, Easter and Christmas the team might produce no working products while time is still passing. So perhaps I should have reduced my target of 26 points for the day to just 22. We would then score zero points over tea and lunch while still covering the some topics.
I told the team that we could also have planned a shorter lunch or skipped the tea breaks if we fell behind so we could catch up but some of the crew remained unconvinced. Apparently skipping all the breaks was not seen as a way of learning faster.
So the team agreed that our learning velocity was a great tool for planning the day and constantly re-prioritizing but a really bad tool for measuring the value of what we covered.
I might end this article here – but it did open up a topic we should discuss next. The agile measure of “velocity” is actually a measure of speed.
I could certainly speed up by failing to take questions and cutting the quality of the conversations … like some teams could stop fixing defects or drop quality (and even hard code) to maintain speed. But this would be a bad outcome. It would mean that instead of us using velocity as a tool to help the team achieve its goals the team would have been acting like a bunch of tools trying to make a graph look pointlessly pretty.
So if we really want a measure of progress in an agile project then we need to add a measure of direction to our measure of speed. We need to understand where we are going, how we know we are heading in the right direction and how we know we have really completed each topic.
So next time I will explain how velocity is meant to fit in with other measures rather than being a stand-alone measure (or even goal) that is taken out of context.

Leave a comment